
Payment Fraud Detection
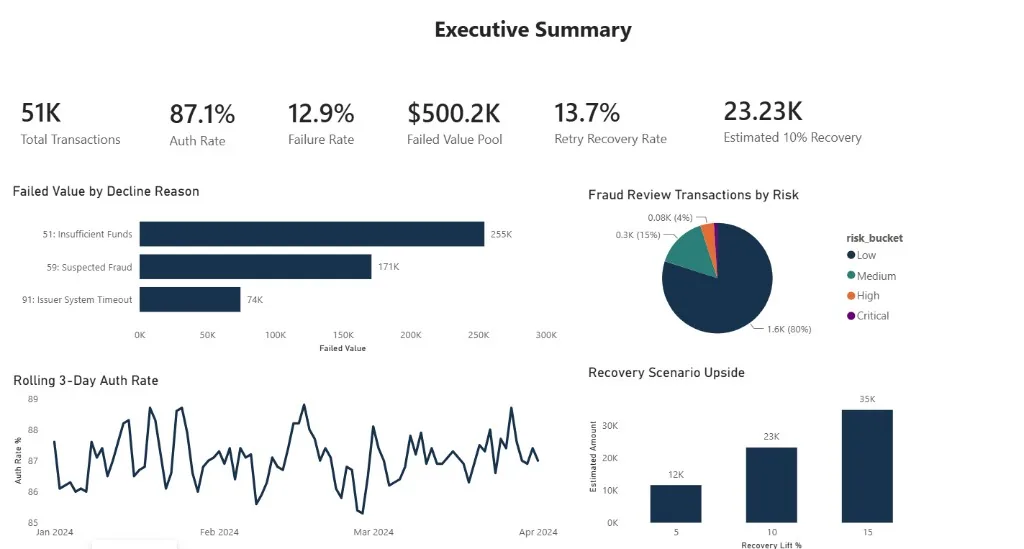
Analyzed 51K+ payments to quantify $500K+ in leakage · built a gradient-boosting fraud risk model that concentrates fraud 1.7× above baseline (9.5% vs. 5.5%) · isolated $232K in retry-recoverable value.
Explore DashboardData Analyst and MS Information Systems candidate, graduating May 2026.
I build end-to-end analytics workflows using SQL, Python, BigQuery, Power BI, and Excel - from data preparation to stakeholder-ready dashboards. Portfolio outcomes include a fraud review queue hitting 9.5% precision on 51K+ payments, a 100K-patient care-pathway model quantifying +610 recoverable diagnoses, and $2.31M in profit exposure isolated across 65K+ supply chain orders.
A selection of projects showcasing my analytical skills and problem-solving approach.
Analyzed 51K+ payments to quantify $500K+ in leakage · built a gradient-boosting fraud risk model that concentrates fraud 1.7× above baseline (9.5% vs. 5.5%) · isolated $232K in retry-recoverable value.
Explore Dashboard
Engineered a Python/SQL pipeline processing a 1.1M+ record EHR dataset into a validated 15,000-patient care-pathway mart · 73.7% pathway attrition · isolated 35.4% and 34.1% drop-offs at referral and specialist-access stages · modeled +610 recoverable diagnoses from two targeted fixes.
Explore Dashboard
Built a BigQuery ETL pipeline aggregating 180K+ item records into 65,752 distinct orders · uncovered $2.31M in high-value profit exposure from ineffective SLA routing · prioritized the 5 lanes driving 41.2% of breaches, modeling 3,097 addressable breaches and $309K in exposure.

Built a validated Audience Value Index across 4,562 films · Horror is 2x more capital-efficient than any other genre · big budgets buy safety, not efficiency (8.9% vs. 37% loss rate) · sequels fade to 61% of opener value by film 2. Delivered as SQL, Excel, and a 5-page Power BI dashboard.
Real report pages from each project's Power BI dashboard or analysis output.
Pandas, NumPy, Scikit-learn, predictive modeling, cohort and funnel analysis.
Advanced SQL with CTEs, window functions, PostgreSQL, and BigQuery analytics workflows.
Advanced DAX, Power Query, KPI framework design, and stakeholder-ready interactive dashboards.
GCP BigQuery, PostgreSQL, ETL/ELT pipelines, data warehousing, and data modeling.
Pivot tables, XLOOKUP, scenario planners, and stakeholder-ready workbooks.
A/B testing, root cause analysis, KPI development, and operational performance diagnostics.
I'm Uday Prakash Lakkaraju, a data analyst pursuing an MS in Information Systems at Stevens Institute of Technology (GPA 3.6), graduating May 2026. My work sits at the intersection of analytics engineering and business impact. "What decision does this data enable?" is the question I bring to every project.
My toolkit includes advanced SQL, Python, GCP BigQuery, PostgreSQL, Power BI, and Excel. I've built ETL/ELT pipelines, predictive fraud models, and KPI frameworks that move teams from manual reporting to reliable, self-serve insight.
I enjoy solving analytics problems across fintech, healthcare, and operations domains, with a focus on measurable outcomes. Based in Sacramento, CA, I'm seeking full-time Data Analyst and BI Analyst roles.

GPA 3.6 | Hoboken, NJ. Coursework focused on Business Intelligence & Analytics, Data Integration, and Database Management Systems.
Saved 14-17 hours/month by building a Python and SQL reporting workflow, cutting turnaround from 3-4 hours to under 1 hour. Consolidated 85,000+ records from 5 source systems into PostgreSQL with validation controls, improving data consistency across 4 departments. Flagged 500+ at-risk students across 60,000+ records using SQL ranking and Excel pivot analysis, presenting findings to 4 department heads.
Hyderabad, India. Coursework in Machine Learning, Statistical Methods, and Data Structures & Algorithms - building the technical foundation for a career in data.
I'm actively looking for data analyst and BI opportunities. Let's connect and see how I can add value to your team.